

8 Raster tools
Facilitate execution of the Raster method.
To assist in performing risk evaluations using Raster, two free tools are available. See https://risicotools.nl/ for download locations.
The first tool is a standalone MacOS or Windows application that edits Raster project files stored on a local or network drive. The second tool is web based. It is to be installed on an intranet server and allows access to shared projects from any web browser on the local network. In both tools, a project contains the complete risk assessment for a single organisation. Typically, a project encompasses several telecommunication services.
With minor differences, both tools work in the same way. One major difference with the intranet tool is that multiple analysts can work on the same project simultaneously; each change is shared with other members instantly and automatically. Working with the standalone tool and Working with the intranet application describe the specifics of the standalone and intranet tool respectively. The rest of the chapter and the subsequent chapters apply to both tools.
In both tools, hovering the pointer over a button or item will usually show a popup with a brief explanation of its function.
8.1 Working with the standalone tool
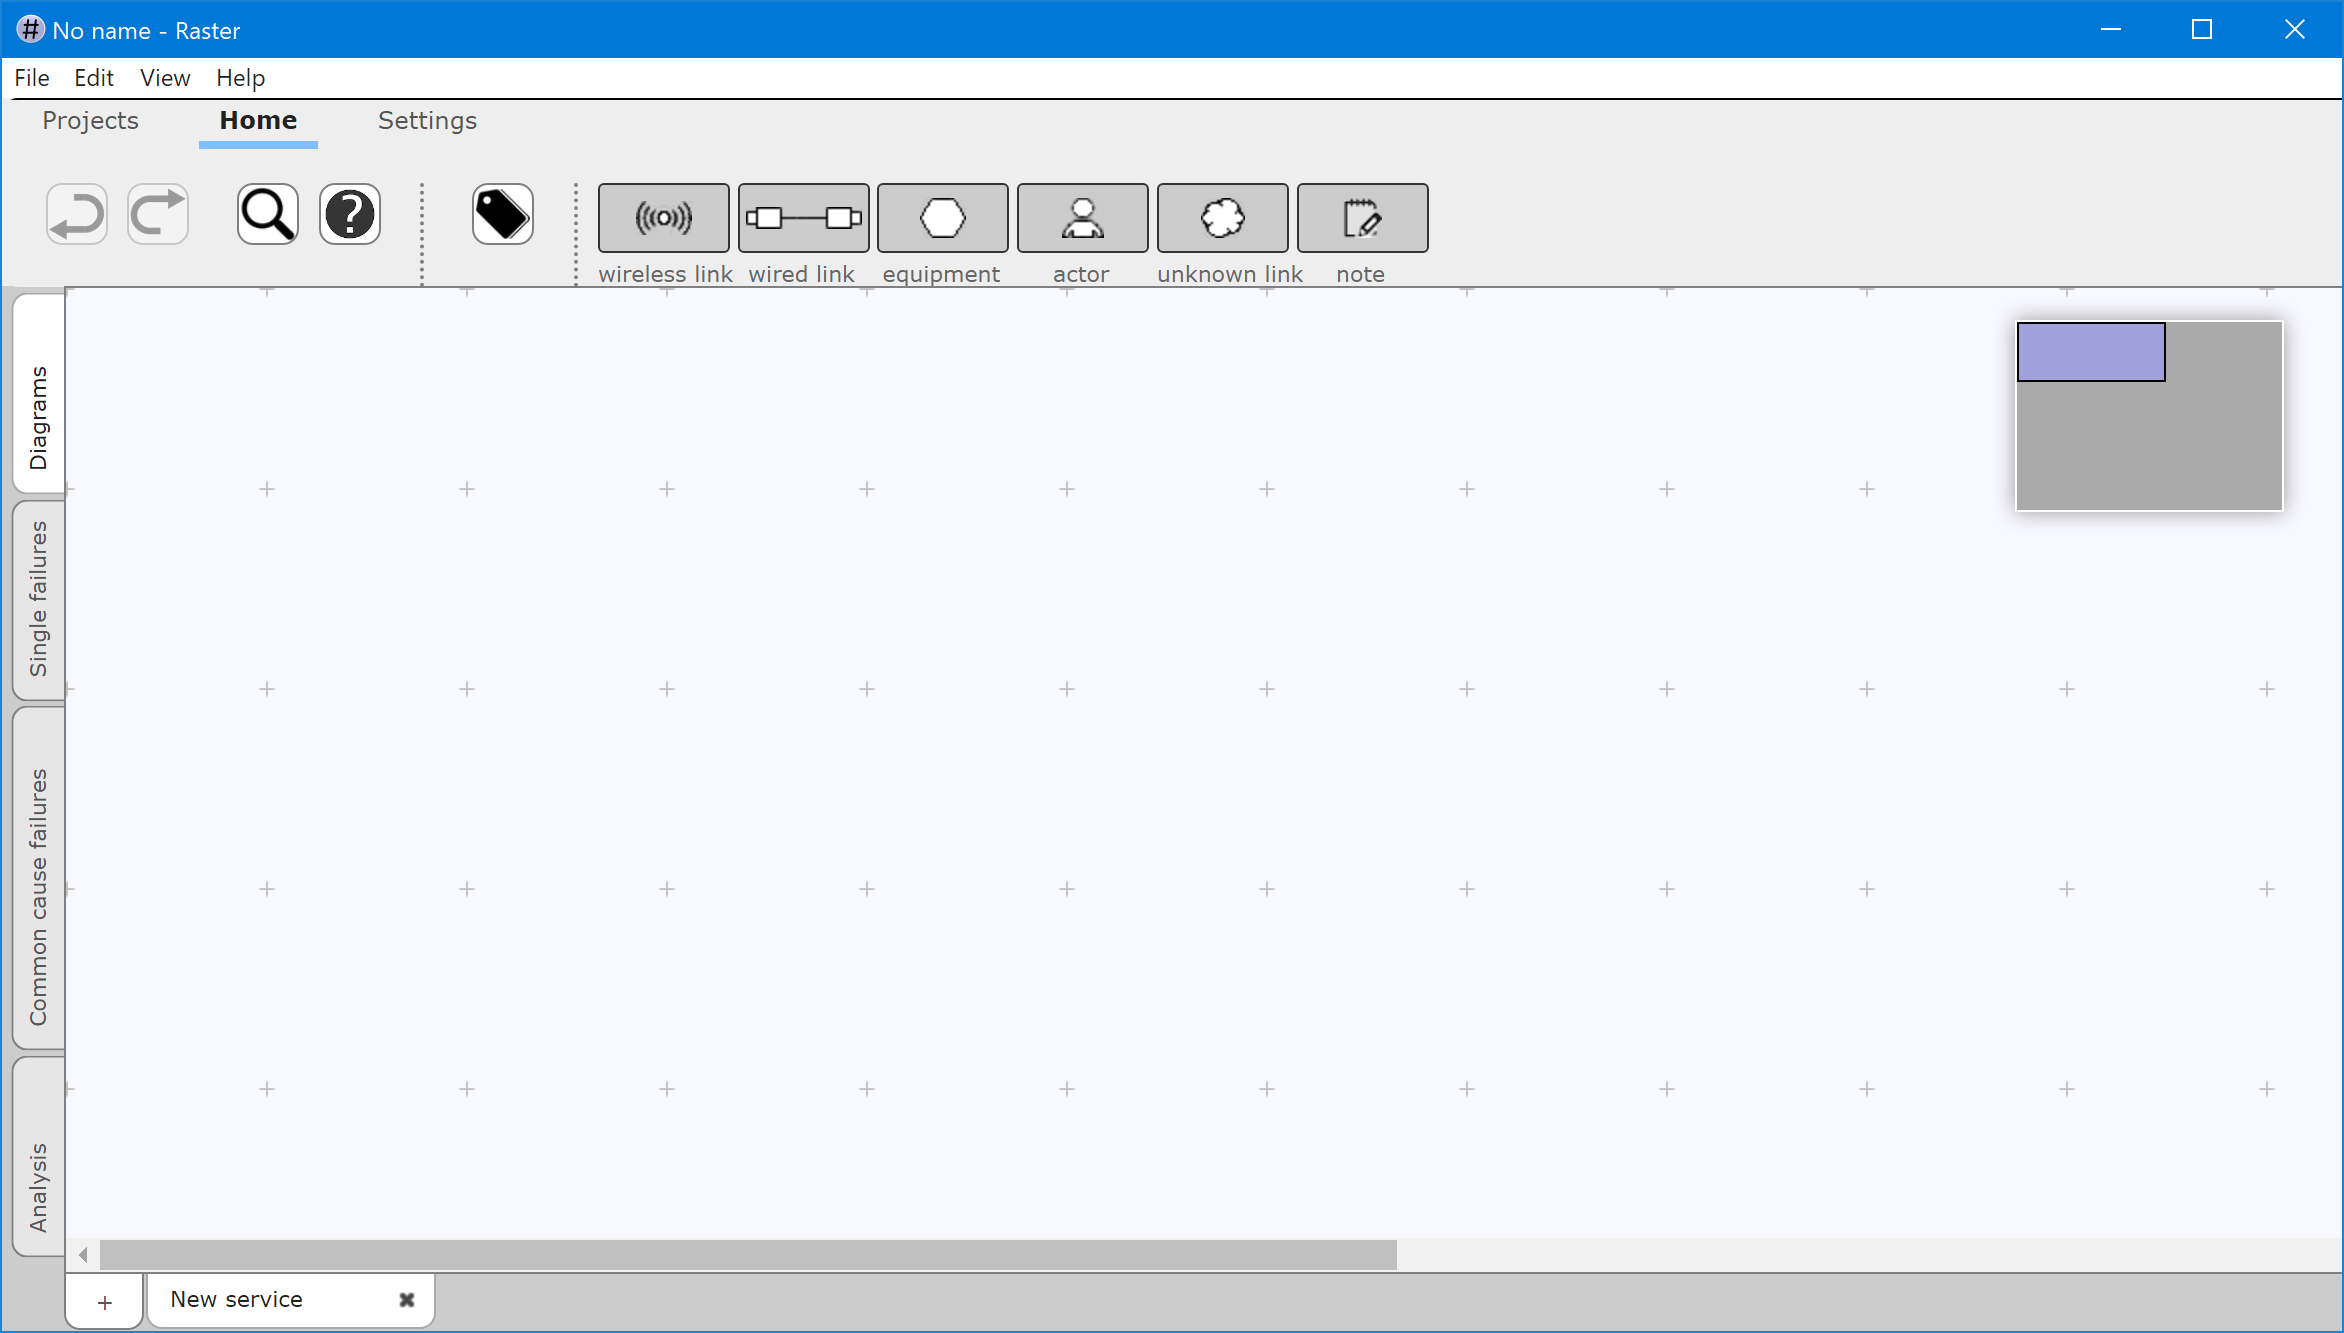
The standalone tool operates on project files stored on local or network drives. Project files are opened, edited and saved very much like how you edit text documents or spreadsheets. Pictured above is the Windows version of the tool.
8.1.1 File menu
The File menu is used to open, save, and print project files.
You can save your current view as a PDF file. To save a diagram, its list of single failures, the list of common cause failures, or the tables in the Analysis view, use the option “Save as PDF” in the File menu. This option will always save the current view. Your preferences from the Settings toolbar and View menu will be respected.
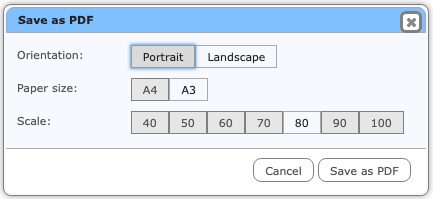
Before you save, review the PDF settings. You can:
- choose orientation (Portrait or Landscape). Landscape (wide) orientation is often best for diagrams; Portrait (tall) is often best for all other views.
- choose paper size. Use A3 for large diagrams, A4 for any other views.
- choose the scale. 80% to 100% is often best, but to fit large diagrams on a single sheet you my have to go down to 40% scaling.
8.1.2 View menu
The View menu is used to change layout and preferences. The first section contains the same functions as the Settings toolbar: Labels, Vulnerability levels and the Mini-map. The items on the second section can also be found in the toolbars: Find (on the Home toolbar), Edit labels (on the Home toolbar in Diagrams view), Project details (on the Projects toolbar).
You can change:
- Zoom: increase or decrease the size of diagrams or text. For large diagrams it may be useful to shrink the text and images to fit more of them on the screen.
- Full screen: expand the tool to make it use all available screen space.
8.2 Working with the intranet tool
The intranet tool can handle multiple projects, but only one can be active at any time. Multiple analysts can work on the same project simultaneously; each change is shared with other members automatically.
Pictured below is the intranet tool, running in Edge.
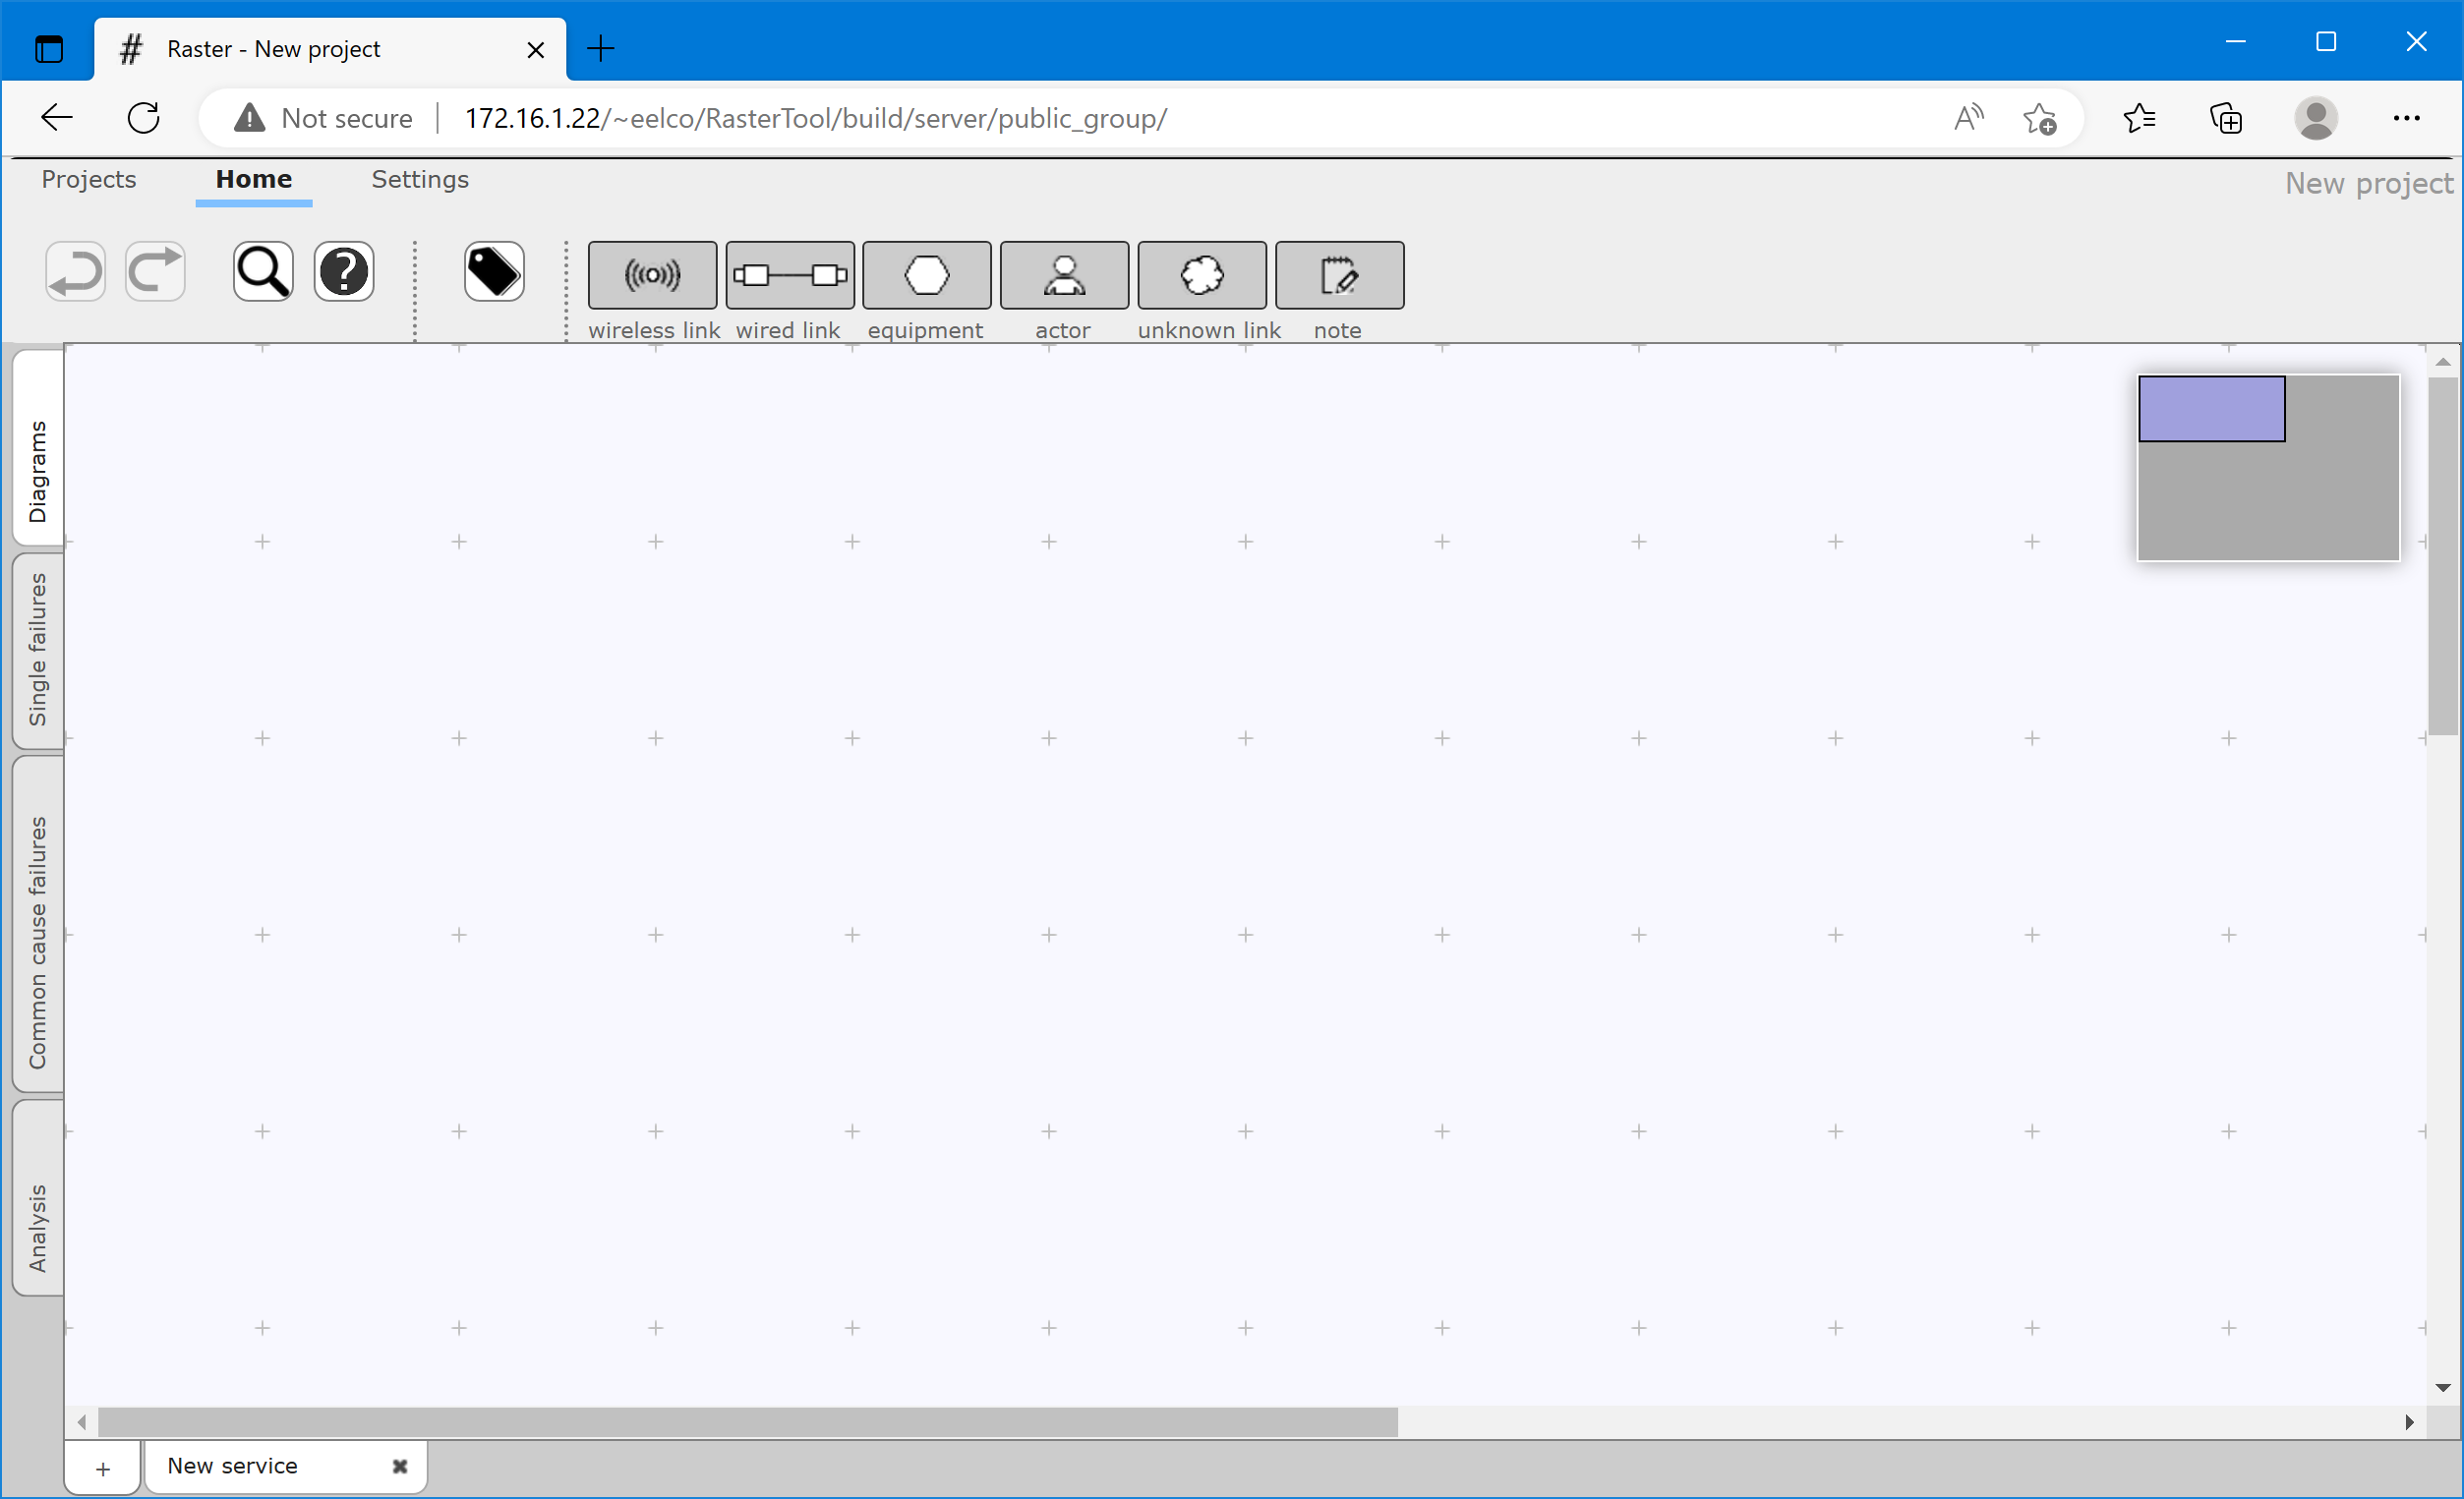
The editing that you perform is recorded instantly. This means that if you close your browser window none of your work is lost. When you visit the tool's URL again, the state of your workspace will be fully restored. It is therefore also not necessary to save your work, or to open a file before commencing work.
8.2.1 Private and shared projects
Projects can be private or shared. Shared projects can be edited by multiple people at the same time. Any changes you make to a shared project are immediately propagated to all other people currently editing the same project; any changes that they make are immediately reflected in your own browser.
Private projects are not visible to other people, and are never stored on the server. When you work on a private project and visit the tool's URL from a different machine, or even using a different browser on the same machine, your previous work is not restored. This does not mean that your work is lost; it is tied to one particular browser. To transfer a private project between machines or browsers, or if you wish to share your projects with a co-worker, you must export that project. By exporting, all data of the project is saved into a project file, which can then be stored and transferred as any other file. Exporting is explained in The Project toolbar. Likewise, such a project file can be imported using the Import function. After importing, any changes will again be recorded instantly. However, they will not affect the file; the file is not modified until you decide to export again.
8.3 Toolbars
At the top there are toolbars to control the tools: Projects, Home and Settings.
8.3.1 The Projects toolbar
Use the Project toolbar to add, remove, modify and swap between projects. The intranet tool and the standalone tool have slightly different toolbars.
For the intranet tool:

For the standalone tool:
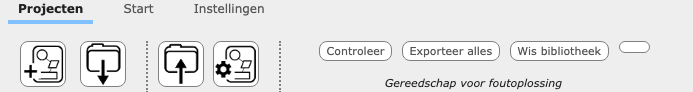
The Project library shows a list of all projects that are currently available for viewing and editing. The list of projects is divided into three sections: your private projects, shared projects that you have worked on, and other shared projects.
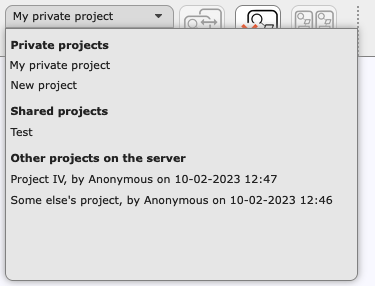
The selected project can be acted upon using the three buttons to the right. You can:
- activate the project, to start viewing and editing it.
- remove the project.
- merge the project into the currently active project. All services of the highlighted project will be re-created as services of the active project.
The project properties allow you to change important aspects of your project.
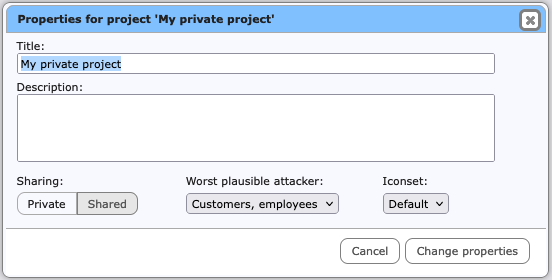
- change the name or description of the project.
- change whether the project is private or shared; see Private and shared projects
- set the worst plausible attacker for cybersecurity vulnerabilities. See XXX
- change the icon set for the project.
Icon sets contain graphical representations of components in your diagrams. By default the icon sets Classic and Default will be installed. Your can create your own icon sets, or extend the predefined ones (see XXX).
The Projects toolbar may contain functions for debugging. These are temporary, and can be ignored.
8.3.2 The Home toolbar
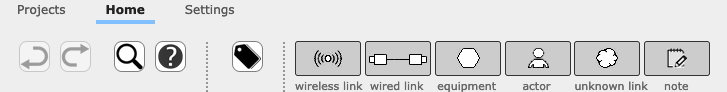
The Home toolbar is used for editing and viewing information. It is the same for the intranet and standalone tools. The first section is fixed, and contains the Undo, Redo, Find and Help buttons.
The second section contains buttons for each of the four views. Below is the toolbar for Diagrams view.
8.3.3 The Settings toolbar
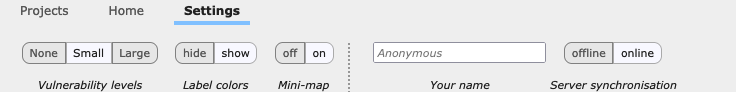
The Settings toolbar provides settings and other preferences. The one from the intranet tool is below.
The standalone tool has a smaller toolbar.
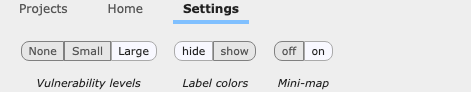
- Vulnerability levels: The size of the vulnerability level indicators (see Diagram nodes) can be switched between large and small, or they can be hidden entirely.
- Labels: The colours that are associated with labels can either be hidden or shown. When hidden, nodes are always painted in plain black and white, as if no label was assigned to them. Hide the label colours when you find this too distracting, or before printing to a black and white printer.
- Minimap: Hide or show the minimap during editing or before printing.
The preferred size of the vulnerability level indicators and the label colours also affect printing.
The intranet tool has two extra settings.
- Your name: The server stores the name of the last person to modify a shared project, together with the date of modification. Enter your name here; this is purely informational.
- Network connection: The network connection to the server is normally automatically set to either offline (disconnected) or online (connected). You can (re-)enable communication with the server by switching to online.
8.4 Printing
You can print a diagram, its list of single failures, the list of common cause failures, and the tables in the Analysis view. The print view looks very different from the normal screen display; the tabs, buttons and other user interface elements will not show up in the printed document.
When using Firefox, the mini-map is reset to the top-left position and single or common cause failures are expanded just before printing. With other browsers, you may have to do this manually. You can use the “Expand all” function before printing.
When printing the diagrams, it is best to set the paper size to A3 and landscape orientation. A4 paper may suffice for smaller diagrams. The Single Failures and Shared Failure views are best printed using portrait orientation. You may need to shrink the printout to make it fit the paper, using the printing features of your web browser.
Make sure that the printing of background colours is enabled in your web browser, otherwise the risk classification indicators will all show as white. The option to print background images is not relevant; the printed document does not contain background images.
You can use the Settings toolbar to set the size of the vulnerability level indicators and choose whether label colours are printed. These setting apply to both the printed and the on-screen version of the intranet tool.
8.5 Main views
Both the standalone tool and the intranet tool are divided into 4 main views, indicated and selected by the vertical tabs on the left-hand side.
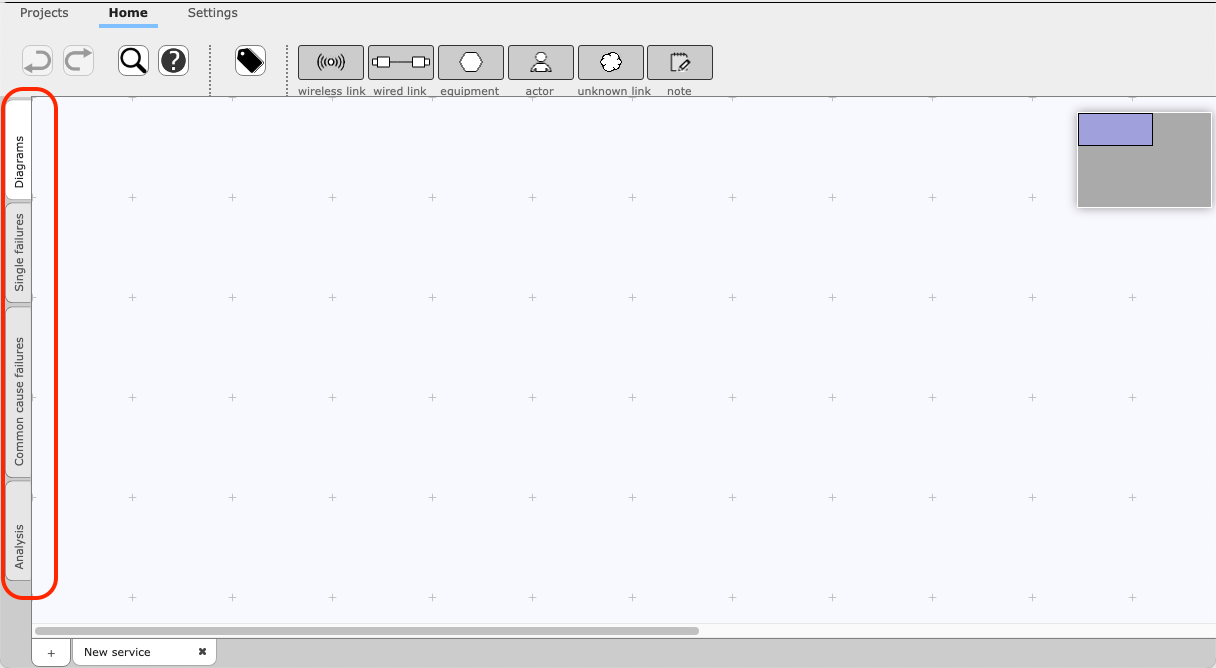
- Diagrams view is used to draw and edit diagrams of telecom services.
- Single failures view is used to assess failures of individual elements.
- Common cause failures view is used to assess common cause failures.
- Analysis view is used to view reports on completed diagrams, and to see the effects of individual vulnerabilities on overall vulnerability levels.
8.6 Find nodes
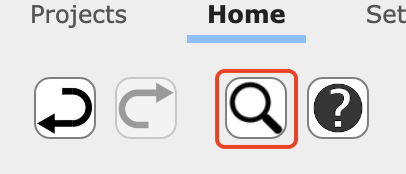
When diagrams get larger and the number of diagrams increases, it can become more difficult to remember in which service nodes are located, and what their names were. Use the looking glass icon to call up a search window.
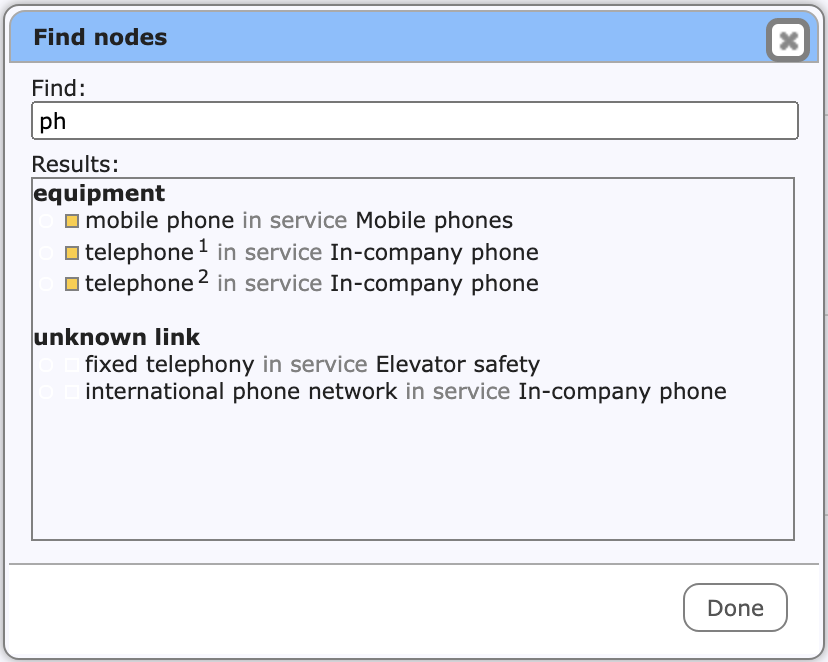
Search results will be presented as you type. The overall vulnerability level (when available, as a coloured square) and label colour (if set, as a coloured circle) will be shown.
Click one of the search results to reveal that node in the diagram. De tool will jump to the diagram view and will mark the node using a frame.
8.7 Help window
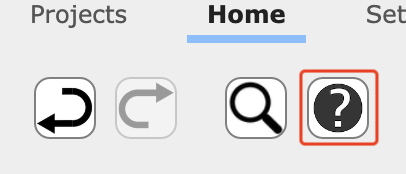
The Help window shows the definitions of the Frequency and Impact classes, and provides tips and other information on the tool. Open the Help window using the question mark button.
Since it is important that the definitions of the classes are applied consistently, it is useful to have this reference close at hand.
Assessing Frequencies may be challenging for the analysts. The Help window therefore offers a calculation tool.
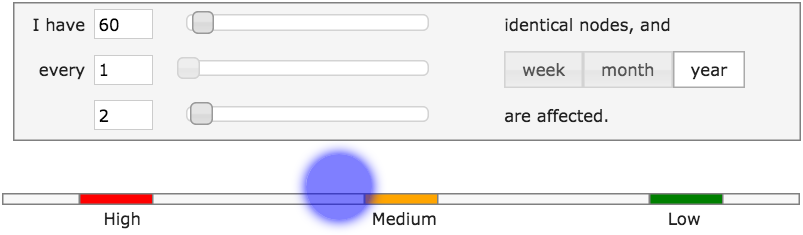
If the organisation deploys 60 tablets, of which two fail each year, then the calculator helps to determine that this poses a Medium frequency.
8.8 Colour codes
In several locations colours are used to indicate the overall vulnerability level for a node. If size permits, a letter is also shown. The following letter and colour combinations are used:
 Not yet analysed, no
assessment has been done yet (white)
Not yet analysed, no
assessment has been done yet (white)
 Ambiguous, the
assessors have conflicting opinions (purple)
Ambiguous, the
assessors have conflicting opinions (purple)
 Extremely (very)
high, an extreme risk (bright red)
Extremely (very)
high, an extreme risk (bright red)
 High (red)
 Medium
(yellow-orange)
Medium
(yellow-orange)
 Low
(green-orange)
Low
(green-orange)
 Unknown, because of lack of
knowledge (sky blue).
Unknown, because of lack of
knowledge (sky blue).
 Extremely (ultra)
low, the risk level is negligible or absent (bright green)
Extremely (ultra)
low, the risk level is negligible or absent (bright green)
8.9 Keyboard shortcuts
| Ctrl-Z | Undo |
| Ctrl-Y | Redo |
| Ctrl-Shift-Z | Redo |
| Ctrl-F | Open the Find window |
| Ctrl-L | Open the label window |
| F1 | Open the help window |
| Ctrl-1 | Go to Diagrams view |
| Ctrl-2 | Go to Single failures view |
| Ctrl-3 | Go to Common cause failures view |
| Ctrl-4 | Go to Analysis view |
| tab | Cycle between toolbars |
MacOS-users can use the Cmd key instead of the Ctrl key.
| < | Label the node with the previous label from the list (see Node labels). |
| > | Label the node with the next label from the list (see Node labels). |
| F2 | Rename the node, or edit the note. |
| Delete, Backspace | Remove the node. |
| Enter, Return | Open the vulnerability assessment window, or edit the note. |