

5 Stage 3 — Common cause failures analysis
Determine and analyse common cause failures.
A common cause failure is an event that leads to the simultaneous failure of two or more components. For example: two cables in the same duct can both be cut in a single incident; multiple equipment items may be destroyed in a single fire.
For a common cause failure to happen, the affected components must be within range of each other, according to a critical property. For physical failure events such as fire and flooding, this property is geographical proximity: the components must be sufficiently close to be affected simultaneously. For configuration mistakes it is the similarity in maintenance procedures. For software bugs it is whether related firmware versions are used, regardless of geographical distance. Other events may have different critical properties.
For each failure scenario, the critical property has a maximum effect distance. Two equipment items can only be affected by a minor fire when they are in the same room; for a major fire the effect distance is larger, but still limited to perhaps a single building. Flooding has a much larger effect area, and two components must be further apart to be immune from flooding as their common failure cause.
In stage 3 you will make groups of components that fall within the same range of a critical property. You will do this for each vulnerability separately. For each cluster you will then assess the Frequency and Impact of a common cause failure affecting the components in that cluster. The clusters and their assessments will be recorded in the Raster tool. The result is an improved and refined risk assessment.
The Common Cause Failures Analysis stage consists of the following steps:
5.1 Create clusters
The Raster tool automatically lists each vulnerability in use, provided that that vulnerability occurs for at least two components. For each such vulnerability, the analyst must create clusters based on the critical property.
Example: clusters based on geographical proximity can be used for fire, flood, power outage, cable breaks, and radio jamming (per frequency band).
Clusters based on organisational boundaries can be used for equipment configuration, ageing, and software bugs. Initially, the Raster tool places all components that have the same vulnerability in a single cluster. Based on the effect distance of failure scenarios further subdivisions can be made, such that:
- each cluster represents a class of failure scenarios that are similar in location and effect area.
- a failure scenario for a cluster can never affect components outside that cluster.
- any two components in the same cluster may be affected by the same failure scenario simultaneously.
It is possible for a larger cluster to entirely include a smaller cluster. Clusters may thus be nested. All nodes in a subcluster are members of their parent cluster as well.
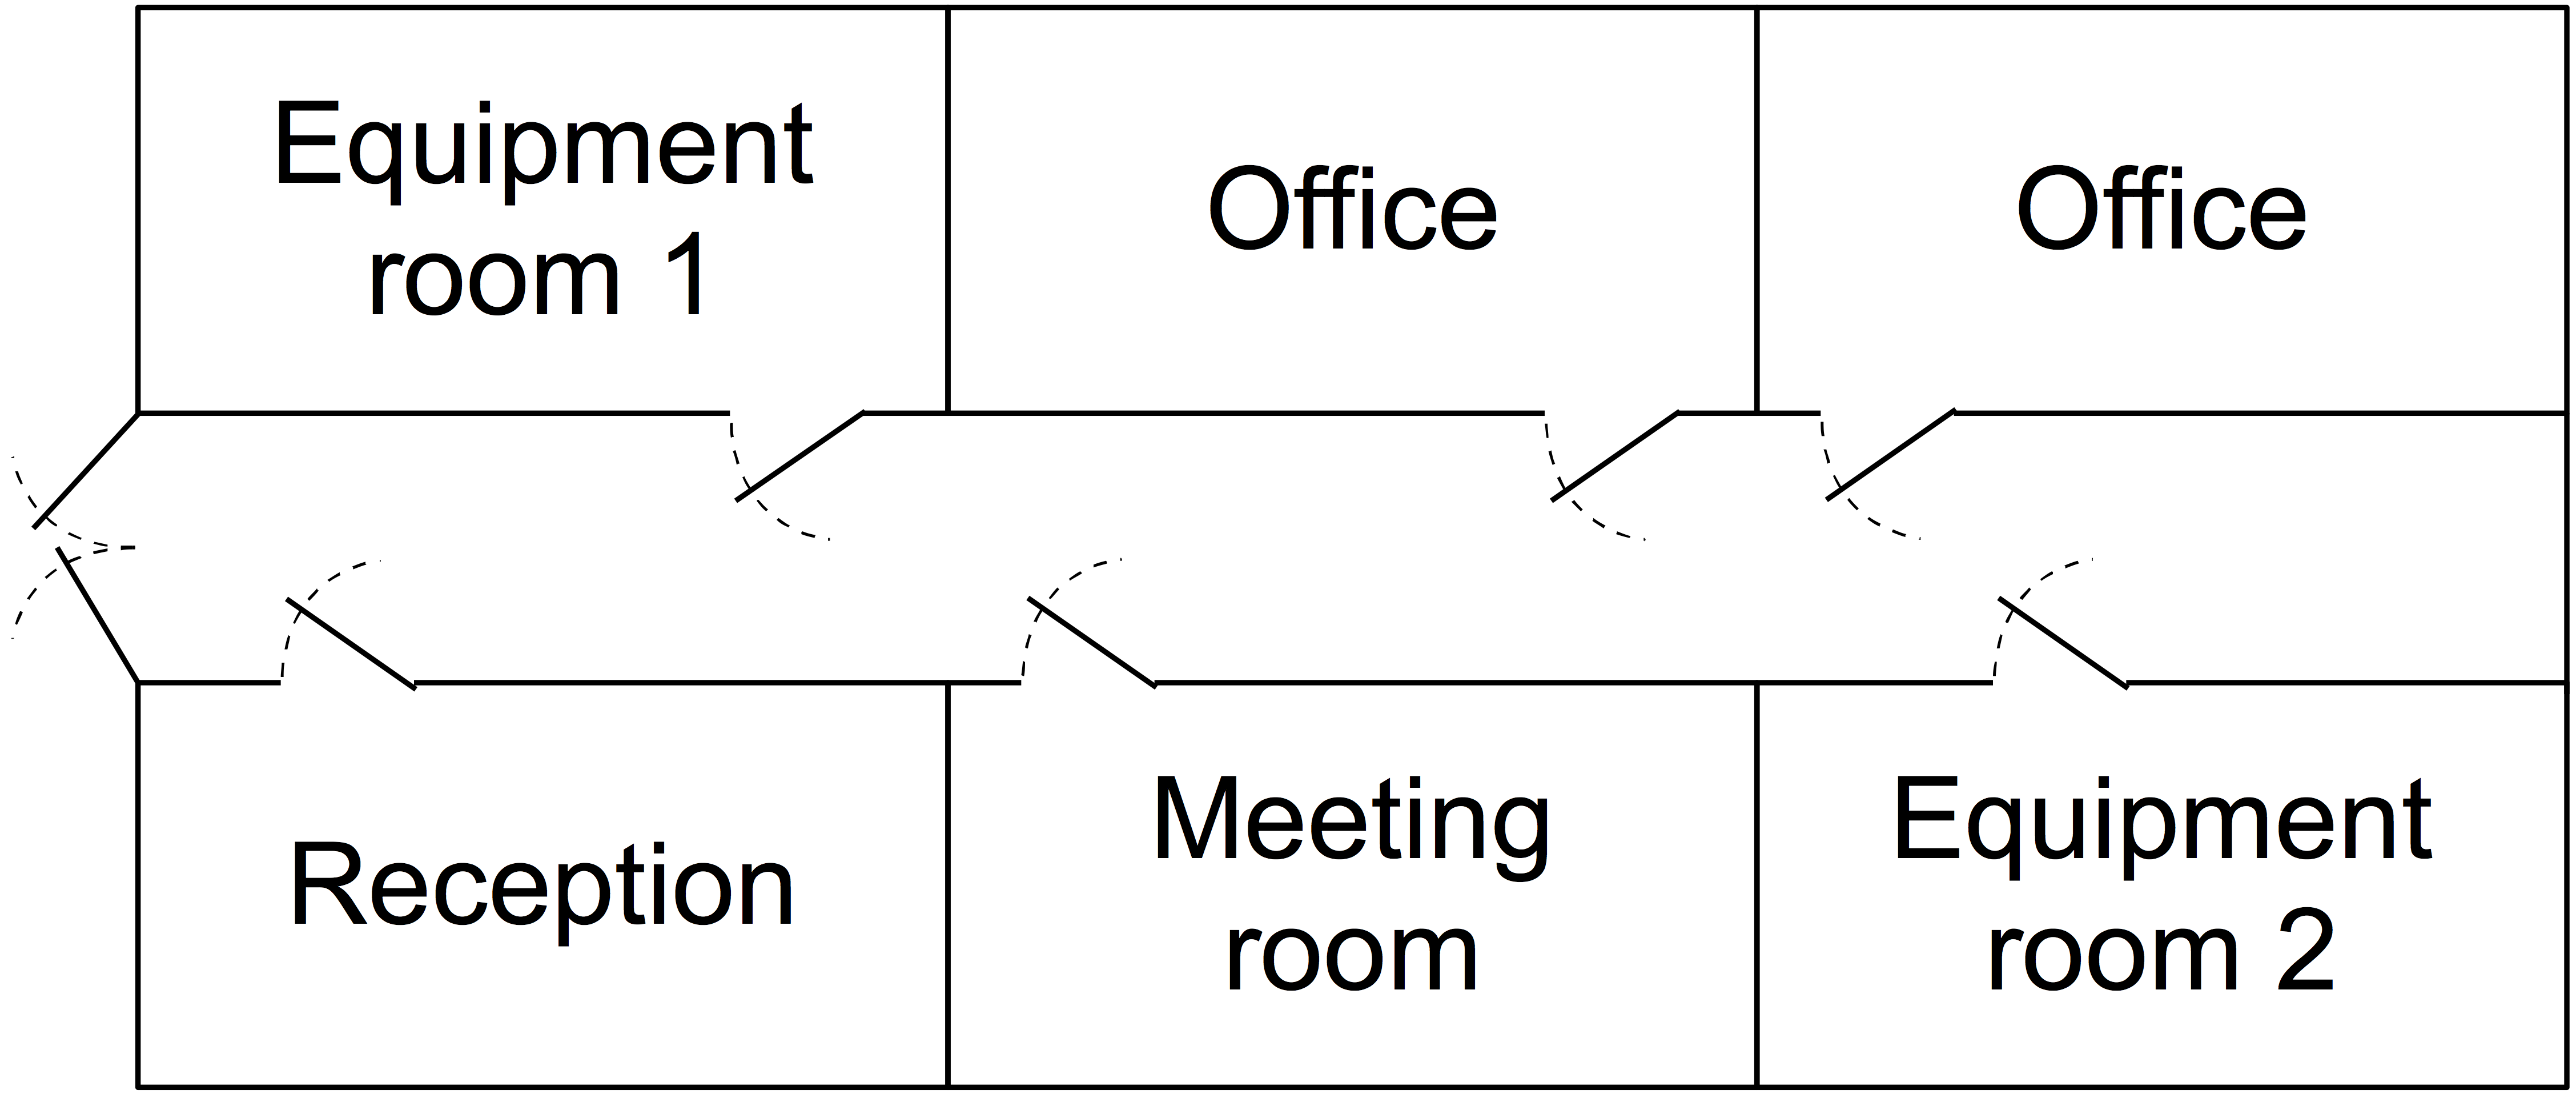
For example, the figure to the right shows an office floor plan with two equipment rooms. Three possible clusters are:
- Equipment room 1 – small fires, affecting components in equipment room 1 only.
- Equipment room 2 – small fires, affecting components in equipment room 2 only.
- Entire office – large fires, affecting all components in all rooms.
Cluster 3 then contains subclusters 1 and 2. Note how each cluster is specific to one vulnerability (fire), and covers scenarios that have the same location and effect area.
The Raster tool is used to create clusters in the Common cause failures view.
5.2 Analyse each cluster
To analyse a cluster the two factors Frequency and Impact must be assessed. This is done in a similar way as for single failures (see Analyse the vulnerabilities of components).
In this stage, the factor Frequency reflects the likelihood that two or more components in that cluster are affected by the failure scenario. It is not required that all components in the cluster are affected. An impact class applies if the failure scenario affects one or more telecom services. For example: when the simultaneous failure of three components in a cluster would cause long-term unavailability of one telecom service, then the impact class High should be assigned to that cluster.
The Raster tool will automatically compute the vulnerability level of any parent clusters, including the top level vulnerability.
5.3 Expand unknown links
When a cluster containing unknown links receives an overall vulnerability level of Ambiguous or Unknown, the analysts must decide whether or not to expand those unknown links. This is analogous to expansion in the Single Failures Analysis stage (see Expand unknown links).
Note that it is not always necessary to expand unknown links. If the analysts think that the effort involved in expansion is too large, or that it will not lead to more accurate or insightful results then expansion should be omitted.
Expansion adds new components to the diagram. These new components need to analysed for single failures. This means that part of Stage 2 needs to be redone for these components. It also means that some clusters receive new member nodes. The analysis of these clusters must be revisited.
5.4 Review
During the final review all analysts must discuss the results of the analysis of single and common cause failures. Special care must be taken to ensure that all assessments are consistent. The next stage must only be started when all analysts agree on the analysis results.
If any of the clusters has an overall vulnerability level of Ambiguous or Unknown, the analysts must decide whether or not to conduct further investigation, in order to be able to assess the common cause failures within that cluster with greater certainty. If the analysts think that the effort involved is too large, or that it will not lead to more accurate or insightful results then the component should be left as is.
If the analysts decide to redo major parts of the common cause failures analysis, then they should perform another review afterwards.