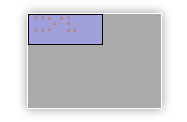
The workspace onto which nodes are drawn and connected, is larger than can be displayed on the screen. Use the mini-map to change the current view. The large grey area of the mini-map represents the total available workspace, while the smaller blue rectangle corresponds to the area that is currently visible (the workspace). Each red dot is one of the nodes in the diagram. Each red dot outside the blue rectangle indicates a node that is currently not visible.
Drag the visible area, by dragging the blue rectangle around. Or move the mini-map itself when it gets in the way, by dragging the grey rectangle around. You can also switch the mini-map off on the Settings toolbar.
When your diagram gets large, you can use the Zoom In, Zoom Out functions of your browser to fit more of the diagram onto the screen. The View-menu of the standalone tool also contains a Zoom function.