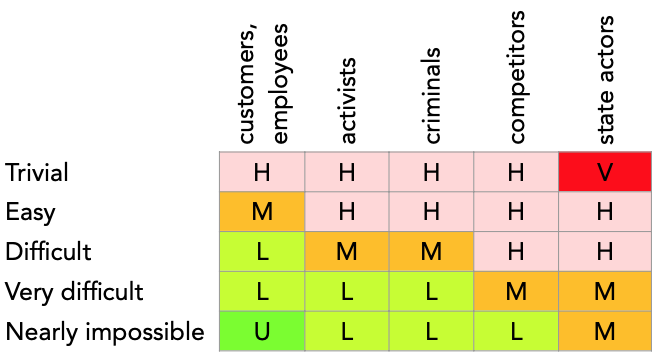
For malicious vulnerabilities the frequency depends on both the worst plausible attacker and the level of difficulty, as in the table below.
The following table describes the way that the Raster tool computes a vulnerability level from a frequency and impact class.
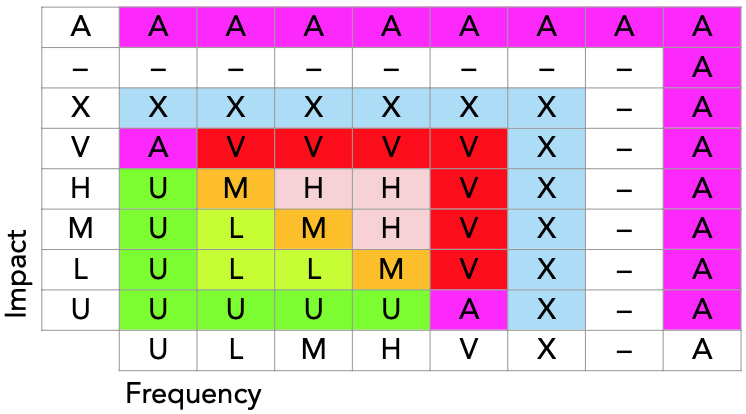
As can be seen from the table, the inner part for frequency and impact L, M, and H match expected damage, even though frequency and impact are not fully numerical. These three classes represent modest values, for which 'frequency times impact' assessment is suitable.
When impact is extremely high (V), it does not matter what the frequency is, as the risk is unacceptable at any probability. When frequency is extremely high (i.e. near certainty), we are almost certain that damage will arise, and are therefore obliged to prepare countermeasures. In this case the risk will also be unacceptable.
When the impact is extremely low (i.e. nearly absent, symbol U), we do not really care whether the incident happens; the risk will always be extremely low to us. The same consideration applies for situations where the frequency is extremely low.
These considerations are ambiguous when one of frequency or impact is V, and the other U. However, we do have a class for ambiguity, namely A.
When either the frequency or the impact is not known, the combination also cannot be known. In these combinations, we always want to preserve ambiguity, as we believe that information to be highly relevant to decision makers. When an undetermined value (the minus symbol in the table) is involved, the result must also be undetermined as that value could turn out to be ranked as ambiguous rather than simply unknown; until we assess the value of that factor, the result of the combination is still undetermined. When neither the value A nor – is appropriate, the combination is ranked as a `plain' unknown (symbol X).
The overall vulnerability score for a node is computed by taking the 'maximum' vulnerability score of all vulnerabilities on that node. The vulnerability levels, in order from lowest to highest, are:
(lowest) - U L M H X A V (highest)Note that here also the symbol – indicates the 'not yet analysed' level.