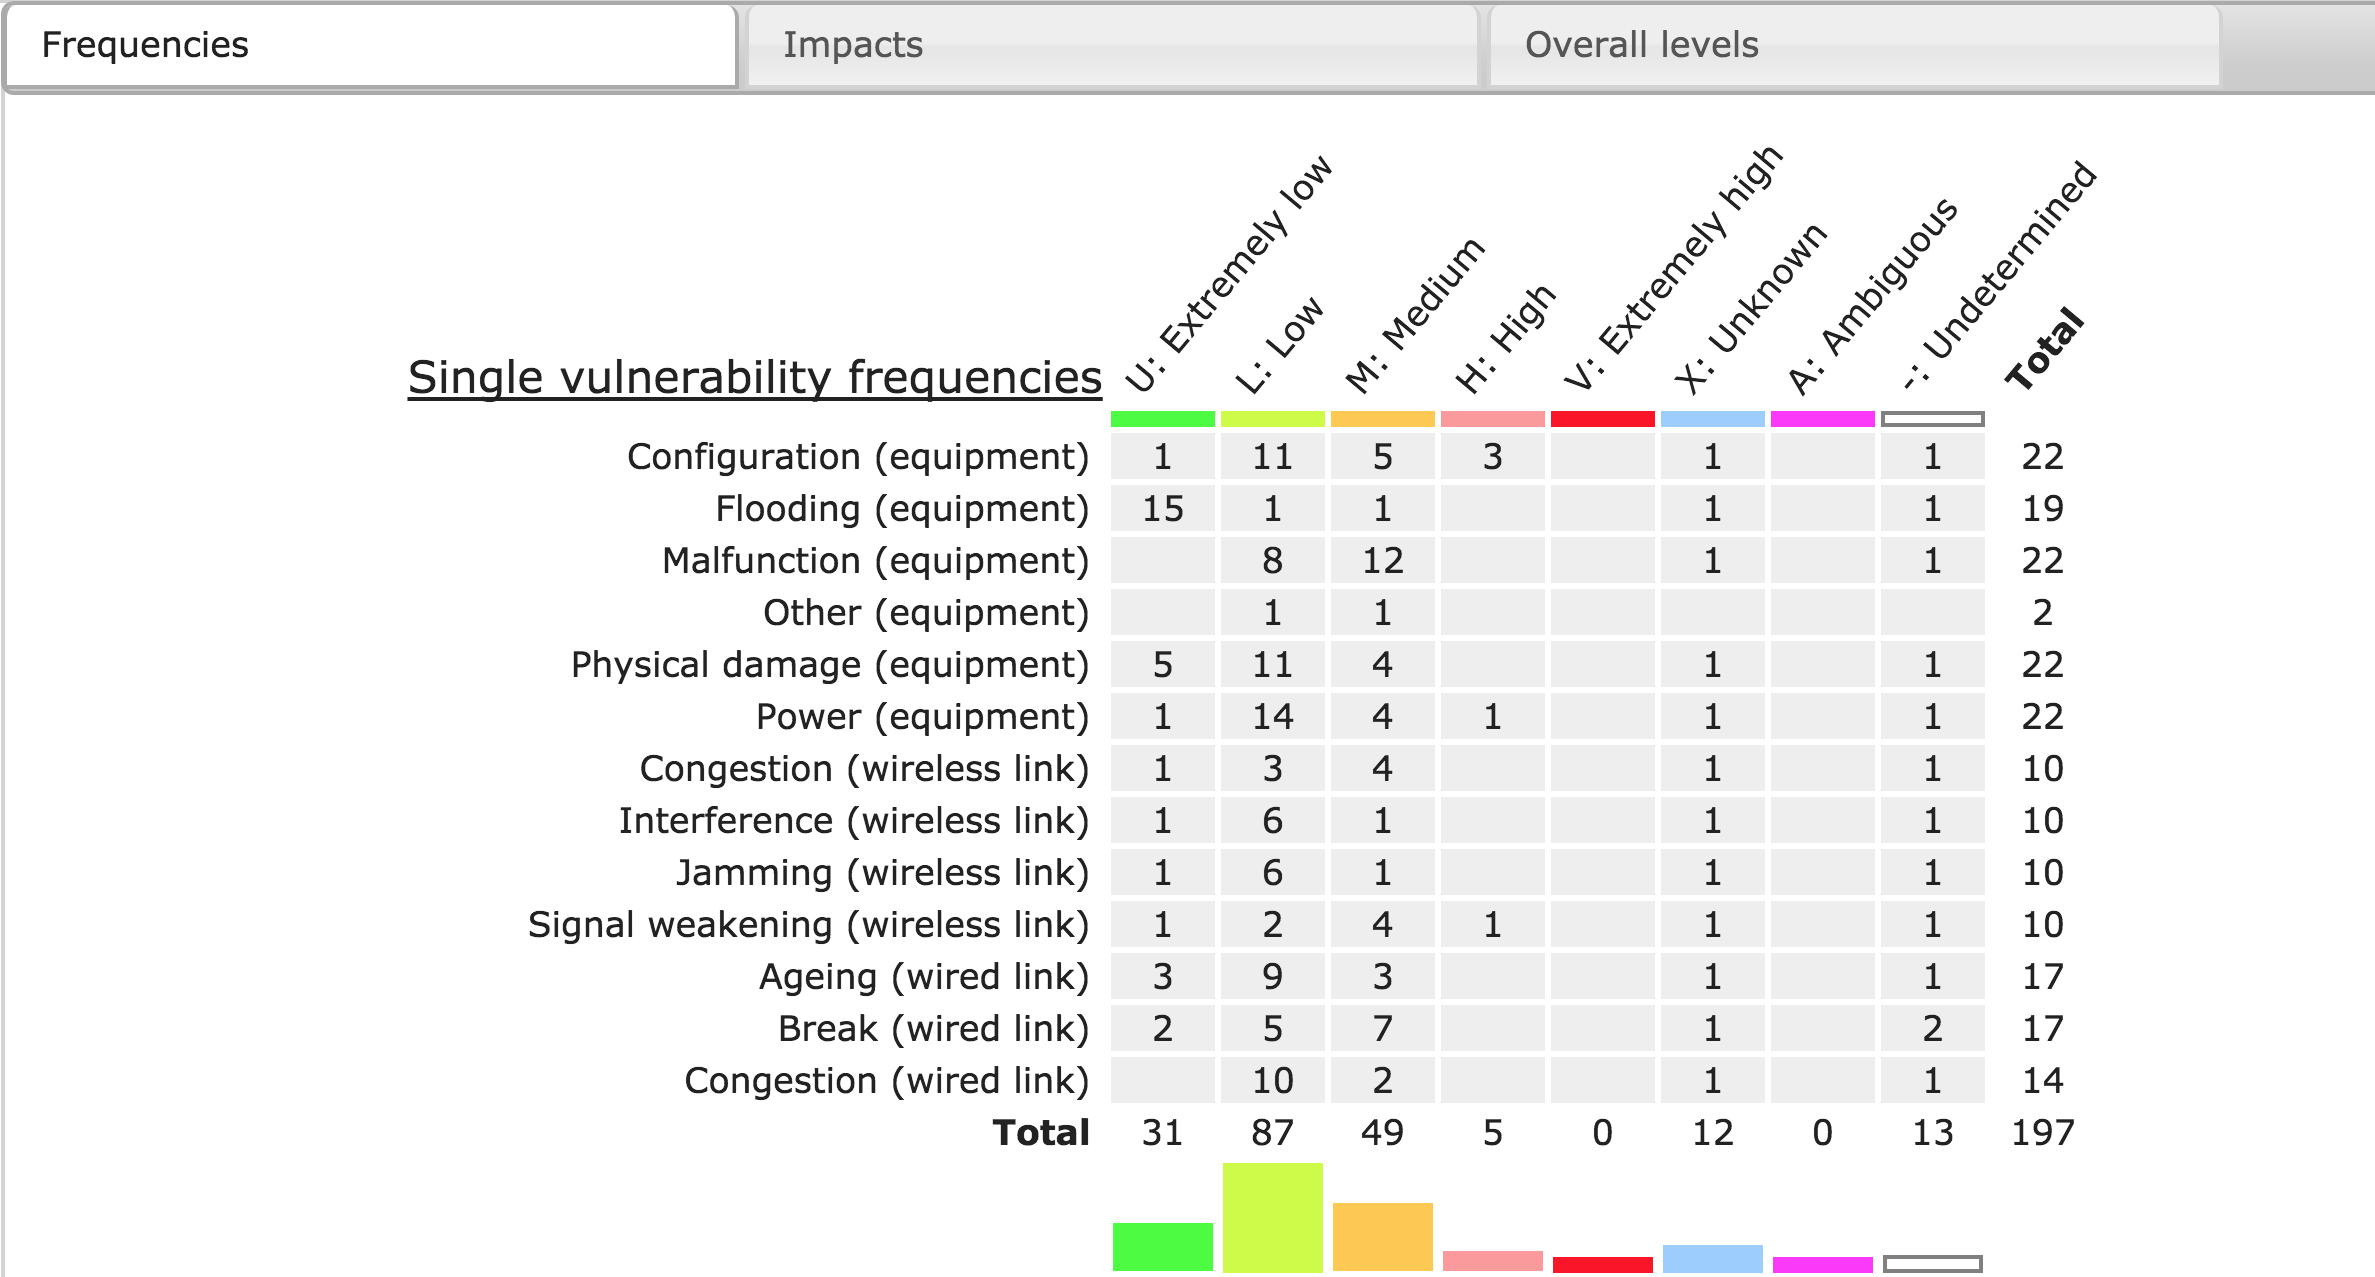
These tables show an overview of all assessments. The Frequencies table shows how often each frequency was assigned in the Single Failure and Common Cause Failures stage, including the totals per frequency class and per node class (both as numbers and visually). The Impacts table does the same for impact assignments. The last table shows the combined vulnerability levels. All tables are informational.