The Raster tool automatically lists each vulnerability in use, provided that that vulnerability occurs for at least two components. For each such vulnerability, the analyst must create clusters based on the critical property.
Example: clusters based on geographical proximity can be used for fire, flood, power outage, cable breaks, and radio jamming (per frequency band).
Clusters based on organisational boundaries can be used for equipment configuration, ageing, and software bugs. Initially, the Raster tool places all components that have the same vulnerability in a single cluster. Based on the effect distance of failure scenarios further subdivisions can be made, such that:
It is possible for a larger cluster to entirely include a smaller cluster. Clusters may thus be nested. All nodes in a subcluster are members of their parent cluster as well.
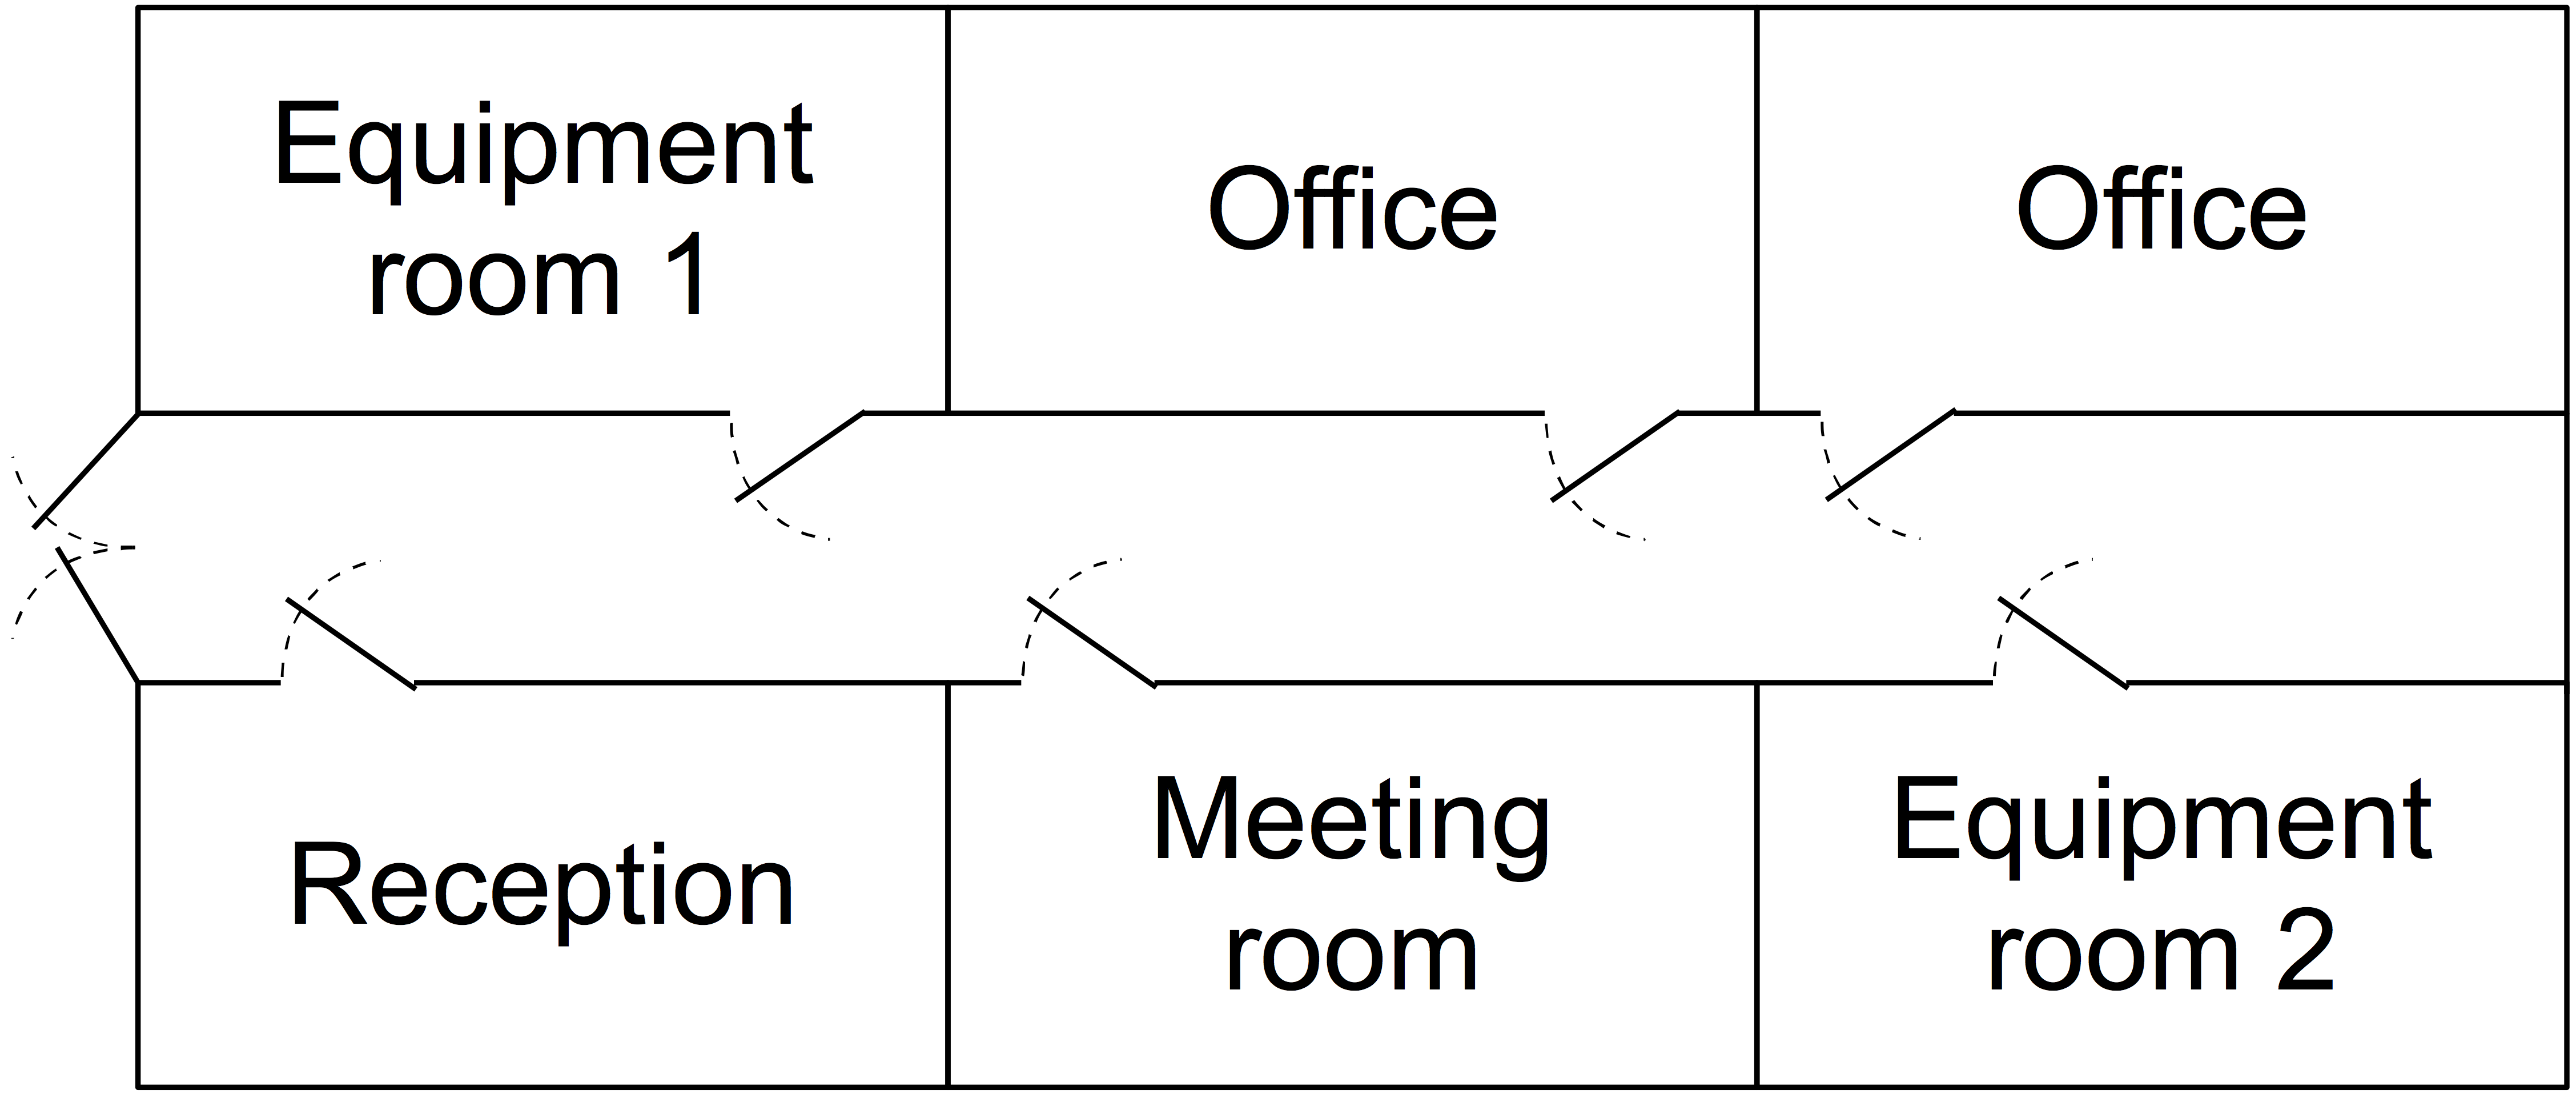
For example, the figure to the right shows an office floor plan with two equipment rooms. Three possible clusters are:
Cluster 3 then contains subclusters 1 and 2. Note how each cluster is specific to one vulnerability (fire), and covers scenarios that have the same location and effect area.
The Raster tool is used to create clusters in the Common cause failures view.